








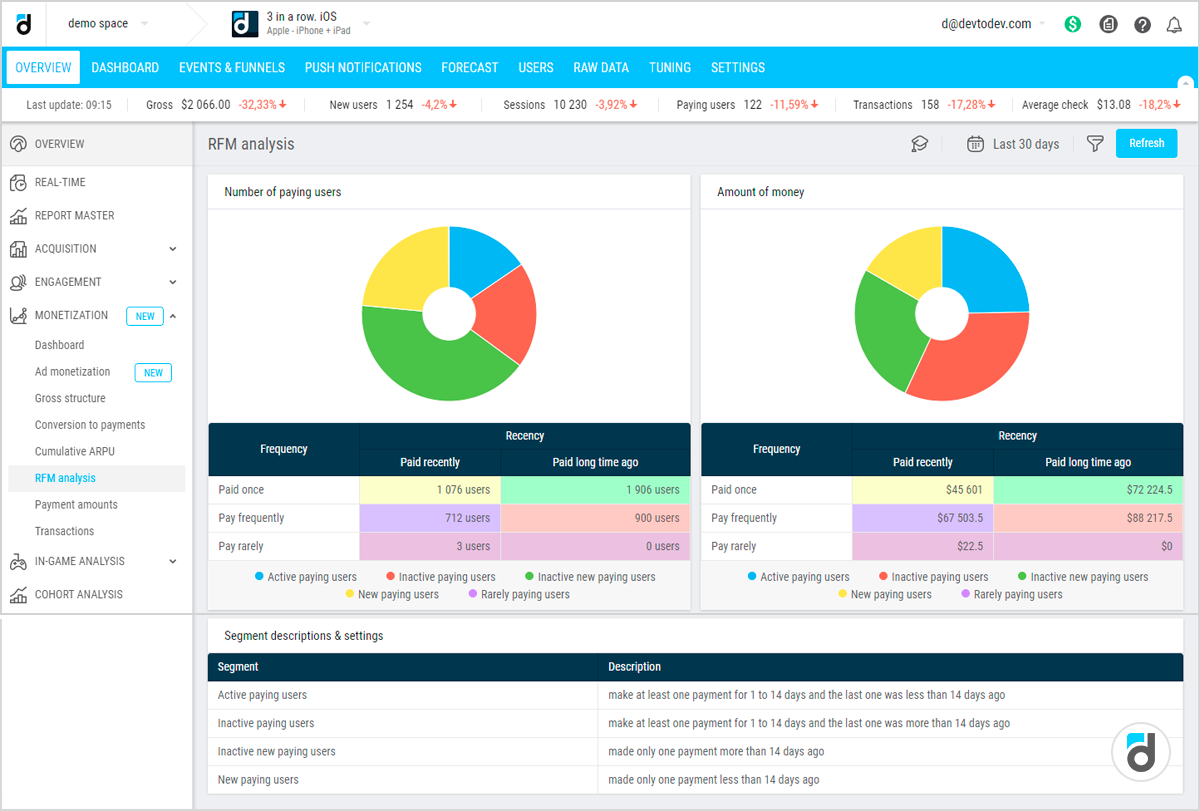
RFM analysis is a data‑driven marketing technique that ranks customers based on three behavioral dimensions: how recently they bought (Recency), how often they buy (Frequency), and how much they spend (Monetary).
Despite being decades old, RFM remains one of the most practical and actionable analytical tools in CRM. It does not require complex algorithms or machine learning. It works with transactional data that almost every business already owns.
Recency measures the time since a customer’s last purchase. Someone who bought yesterday is more likely to respond to an offer than someone who bought six months ago. Recency is typically expressed in days.
The shorter the time since the last purchase, the higher the customer’s attention and engagement. Recent buyers have your brand top of mind and are more receptive to cross‑selling or upselling.
Frequency counts the number of purchases within a defined period, such as the last 90 days or last 12 months. Frequent buyers have stronger loyalty and higher engagement than occasional shoppers.
High‑frequency customers have demonstrated repeated satisfaction with your products or services. They are less likely to defect to competitors and often serve as brand advocates.
Monetary sums the total amount spent by the customer over that same period. High spenders deserve different treatment than low spenders, even if both purchase just as often.
Monetary value indicates the customer’s overall contribution to your revenue. A customer who spends a lot may be more price‑sensitive or may expect premium service levels.
Each dimension captures a unique aspect of customer behavior. A person who bought last week (high recency) but only once (low frequency) and spent very little (low monetary) is a new or occasional buyer.
A person who bought two days ago (high recency), shops weekly (high frequency), and spends $500 per month (high monetary) is a VIP customer.
This customer represents the highest possible value segment. They buy often, spend generously, and have demonstrated recent engagement. They should be nurtured carefully.
A person who bought eleven months ago (low recency) but previously bought monthly for two years (high frequency) and spent $200 per month (high monetary) is a lapsed champion worth reactivating.
These customers have proven their value in the past but have gone cold. With the right incentive, they can often be brought back to active status more easily than acquiring a new customer.
From Dimensions to Segments
The power of RFM emerges when each dimension is split into five groups of equal size (quintiles). Every customer receives a three‑part score based on where they fall in each group.
A customer with a high recency score, a high frequency score, and a high monetary score is the very best segment. They buy often, spend a lot, and have purchased recently.
These are your champions. They account for a disproportionate share of your revenue and should receive your highest level of recognition and retention effort.
A customer with the lowest scores in all three dimensions has not bought recently, buys rarely, and spends little. Between these extremes lie dozens of meaningful segments.
Each combination of scores tells a different story about the customer’s relationship with your brand. A customer with high recency but low frequency is in a different situation than one with low recency but high frequency.
For example, customers with high recency but low frequency and low monetary are recent first‑time buyers who spent little. They may become loyal or never return.
This group is at a critical moment. Their next experience with your brand will likely determine whether they become repeat customers or disappear forever. Focus on onboarding.
Customers with low recency but high frequency and high monetary were once very valuable but have not purchased recently. They need win‑back campaigns.
These customers have already proven their loyalty in the past. They may have left due to a single bad experience, a competitor’s offer, or simply life getting in the way. A targeted win‑back effort can be highly cost‑effective.
Customers with medium scores across all three dimensions are average in every way. They represent the middle majority of your customer base.
They are neither your best nor your worst. Small improvements in their experience can shift them into higher‑value segments, while neglect can cause them to slip into at‑risk categories.
Why RFM Outperforms Simple Segmentation
Traditional segmentation by demographics like age or location is static. A 35‑year‑old man in Chicago does not change his status based on his shopping behavior.
Demographic segments are useful for broad messaging but fail to capture the dynamic nature of customer relationships. A person’s age and income do not predict their next purchase date.
RFM is dynamic and behavioral. It answers what the customer has actually done, not just who they are. A customer who was a low‑scoring buyer six months ago can become a high‑scoring buyer after several large purchases.
Because RFM updates with every new transaction, it reflects the current reality of your customer base. This timeliness makes it far more actionable than static demographic models.
The dashboard updates automatically as new transactions arrive. RFM also directly predicts future behavior. Recency and frequency are the two strongest predictors of repeat purchase.
Marketing scientists have validated this for decades. A customer who bought recently is statistically more likely to buy again soon. A customer who buys often is more likely to continue doing so.
Monetary predicts average order value. Companies that implement RFM typically see three to five times higher response rates when targeting high‑scoring segments compared to untargeted mass emails.
This improvement in response rates translates directly into lower customer acquisition costs and higher return on marketing investment.
Data Requirements for RFM
RFM needs clean, transaction‑level data. Each record should include a customer identifier, transaction date, and transaction amount. Returns and cancellations must be handled consistently.
If you process refunds, you have two options. You can either subtract refunds from the monetary total or exclude refunded transactions entirely. The key is to apply the same rule to all customers.
The time period for frequency and monetary calculations depends on your business model. A grocery store might use 30 days. A furniture retailer might use 365 days. A B2B software company might use 24 months.
Shorter periods are more responsive to recent changes but may miss seasonal patterns. Longer periods provide more stable estimates but react slowly to shifts in customer behavior. Choose based on your average purchase cycle.
Recency uses the last transaction date in history, not just within the defined period. One common mistake is including non‑purchase events like email opens or website visits. RFM is about monetary transactions only.
Including non‑transactional events dilutes the predictive power of RFM. A customer who opens many emails but never buys is not the same as a customer who buys frequently. Keep RFM focused on actual revenue.
Calculating RFM Scores in Practice
To calculate RFM scores, you first determine each customer’s raw recency (days since last purchase), raw frequency (total purchases in the time window), and raw monetary (total spend in the time window).
Next, you sort customers by recency from most recent to least recent. You divide them into five groups of equal size. The most recent 20% receive a high recency score. The next 20% receive the next highest, and so on.
You repeat the same process for frequency, sorting from highest to lowest. The top 20% of customers by purchase count receive a high frequency score. You do the same for monetary value.
The result is that every customer receives a three‑part score, such as high recency, medium frequency, and low monetary. You can then combine these scores into segments using business rules.
Common RFM Segments
Not every possible RFM combination needs individual attention. Most businesses group customers into six to twelve segments that map directly to marketing and retention strategies.
Champions have high recency, high frequency, and high monetary scores. They are the best customers. Reward them with exclusive previews and loyalty points. Do not give them steep discounts.
Champions already see high value in your offering. Discounts may train them to wait for sales, reducing your profit margins. Instead, offer early access, free upgrades, or recognition.
Loyal customers have high recency and good frequency with moderate to high monetary scores. Offer them loyalty programs and cross‑sell complementary products.
These customers are reliable but may not yet be fully engaged. Loyalty programs can increase their frequency and move them into the champion category. Cross‑selling expands their basket size.
Potential loyalists are recent customers with average frequency and monetary scores. They have shown initial interest but have not built a habit yet. Provide onboarding sequences and small purchase incentives.
Your goal with potential loyalists is to accelerate their path to habit formation. A second purchase within a short window dramatically increases the probability of long‑term retention.
New customers made their first purchase recently but only once and spent little. They are at high risk of never returning. Send a welcome series and ask for feedback.
The period immediately after the first purchase is your best opportunity to cement the relationship. A well‑designed onboarding sequence can double the likelihood of a second purchase.
At‑risk customers purchased reasonably well in the past but recency is slipping. They have not bought in 30 to 90 days. Run re‑engagement campaigns or limited‑time offers before they go cold.
These customers have not yet left but are showing clear signs of disengagement. Early intervention is far cheaper than win‑back campaigns after they have already churned.
Lapsed customers were once high value (high frequency and high monetary) but have not purchased in a long time. They are the most valuable win‑back opportunities. Use aggressive offers like 20‑30% discounts.
Because these customers have already demonstrated high historical value, you can justify a higher cost of acquisition to win them back. Even a modest success rate can deliver strong ROI.
Hibernating customers have low recency, low frequency, and low monetary scores. They are generally not worth active retention spending. Include them in low‑cost automated emails.
A monthly digest or seasonal promotion may occasionally reactivate a small fraction of hibernating customers. The cost of such campaigns is low enough to be worthwhile.
Lost customers have no recent activity and minimal historical value. Exclude them from regular marketing. A once‑yearly “we miss you” campaign may recover a small fraction.
Focus your retention budget on customers who still have a realistic chance of becoming valuable again. Lost customers should be deprioritized unless your win‑back economics are unusually favorable.
Dashboard Design Principles
An effective RFM dashboard answers three questions at a glance: who are my best customers, which segments are growing or shrinking, and what should I do next?
A customer distribution heatmap shows average monetary value for each recency‑frequency combination. The top‑right cell should be bright green (high value). The bottom‑left should be dark red.
This heatmap allows you to see at a glance where your customer base is concentrated. A green cluster in the top‑right is healthy. A red cluster elsewhere indicates opportunity.
Segment sizing widgets show current customer count and percentage change from last month. A growing champion segment indicates healthy retention. A swelling at‑risk segment signals an emerging churn problem.
Trends are often more important than absolute numbers. A small but rapidly growing at‑risk segment deserves immediate attention before it becomes a large and urgent problem.
A monetary distribution bar chart shows total revenue contributed by each segment over the last 30 days. Champions may be few in number but often generate 40‑50% of revenue.
This chart helps you allocate retention resources rationally. A segment that contributes little revenue should receive proportionally less attention, regardless of its size.
A segment transition flow (Sankey diagram) shows how customers moved between RFM segments from last month to this month. Champions who became at‑risk are a red flag.
Transition analysis reveals the health of your customer journey. If many new customers become champions, your onboarding works. If many champions become at‑risk, you have a problem.
Finally, provide actionable lists with export buttons for each segment. Without this, the dashboard is just a report, not a tool.
Every segment should have a one‑click action associated with it. Champions: send a thank‑you email. At‑risk: trigger a re‑engagement campaign. Lapsed: launch a win‑back offer.
Integrating RFM with Other Models
RFM is a snapshot of past behavior. Customer lifetime value (CLV) projects future value. Overlay predicted CLV on RFM segments. High‑scoring champions with high CLV deserve premium retention spending.
Two customers with identical RFM scores may have very different future potential due to factors like acquisition channel, margin, or growth trajectory. CLV adds that predictive dimension.
RFM scores are also excellent features for churn prediction models. Recency is the single strongest predictor of churn. Frequency and monetary add independent signals.
When building a churn model, always include raw RFM values as input features. They will almost certainly dominate your feature importance rankings.
After a churn model produces risk scores, segment by RFM to tailor interventions. High‑risk champions receive a personal call. High‑risk loyal customers receive an automated discount. High‑risk new customers get an educational email.
The same churn probability leads to different actions based on the customer’s lifetime value potential. This ensures you invest retention resources where they will generate the highest return.
Organizations that implement RFM dashboards and act on the insights consistently see higher response rates, lower churn, and more efficient marketing spend.